
Monitoring PostgreSQL Metrics with OpenTelemetry

Isha Bhardwaj
November 12, 2025 · 5 min read
In short
PostgreSQL can be instrumented from the application side, which traces SQL calls through OTel SDKs, or from the server side, which reads engine metrics such as cache hit ratio, WAL activity, connections and replication lag. This guide covers the server-side route: enable pg_stat_statements, create a read-only pg_monitor user, and add the OpenTelemetry Collector's PostgreSQL receiver to the metrics pipeline. That gives database-level visibility with no application code changes, exported to Prometheus or any backend.
In modern production systems, PostgreSQL supports critical workloads, and monitoring it can be complex. Engineers must ensure not just uptime, but also consistent query performance, transaction integrity, replication reliability, and efficient resource usage, all of which affect application latency and availability.
Instead of depending on multiple exporters and database-specific integrations, OpenTelemetry (OTel) delivers a vendor-neutral observability pipeline to capture Postgresql performance data, process it centrally, and export it to any metrics backend with minimal configuration overhead.
Client vs Server-Side PostgreSQL Instrumentation
When it comes to monitoring Postgresql with OpenTelemetry, there are two common approaches, each capturing different layers of telemetry depending on where you’re instrumenting from:
Client-side instrumentation (Application-Level Telemetry)
This captures query traces, transaction spans, and latency metrics directly from the application, using OTel SDKs at the driver or ORM level.
It helps correlate application requests with SQL queries, making it easier to spot slow queries, N+1 patterns, or high-latency transactions across services.
Server-side instrumentation (Database Engine Telemetry)
This Collects internal PostgreSQL performance metrics like cache hit ratio, WAL activity, connection utilization, and replication lag through the OpenTelemetry Postgresql Receiver.
That provides visibility into engine-level performance and resource health, exposing issues like lock contention, or underperforming queries within the database system.
| Category | Client-Side (Application-Level) | Server-Side (Database Engine) |
|---|---|---|
| Metrics | Query time, latency | Cache hit, WAL, replication |
| Traces | SQL spans, N+1 queries | Lock contention, slow queries |
| Performance | Transaction efficiency | Throughput, resource usage |
| Errors | Query/transaction failures | Connection/engine errors |
| When to Use | Debug app flow, trace slow queries | Monitor DB health, resource bottlenecks |
| Critical Observations | High latency, retries | Pool saturation, lag |
The above table clearly shows the differences in how observability is achieved in Postgresql from both client and server side perspectives.
In this guide, it gives you deep visibility into Postgresql internals, like replication lag, connection saturation, and cache performance, without modifying application code.
This makes it ideal for teams who want DB-level insights with minimal overhead, mainly focused on Server-side instrumentation.
Monitoring PostgreSQL with OpenTelemetry
Monitoring PostgreSQL is critical to detect replication delays and connection pool saturation before they degrade performance. However, key metrics like I/O utilization, buffer cache efficiency, and active backend states are hidden within internal pg_stat_* views, often requiring custom queries or exporters.
Opentelemetry Postgreqlreceiver streamlines metric collection by querying internal statistics through standard SQL and exporting them in a unified format for seamless backend analysis.
Prerequisites
Before configuring PostgreSQL monitoring with OpenTelemetry, ensure the following:
-
OpenTelemetry Collector installed and configured Official Installation Guide.
-
PostgreSQL running and accessible via a valid connection string (host, port, user, password). PostgreSQL Installation Reference
-
Basic understanding of OpenTelemetry concept of receivers, processors, and exporters for proper pipeline setup. OpenTelemetry Concepts Overview
Instrumenting PostgreSQL with OpenTelemetry
The Postgresql receiver connects directly to the database instance and collects real-time system and performance metrics from built-in statistics views like pg_stat_database and pg_stat_activity.
Step 1 : Enable query stats and create a read-only monitoring user
For instrumenting Postgresql, enable the pg_stat_statements extension to record execution statistics for all SQL queries in your database configuration file .
shared_preload_libraries = 'pg_stat_statements'Now, create a dedicated read-only monitoring user with the pg_monitor role to allow secure access to database statistics.
CREATE EXTENSION IF NOT EXISTS pg_stat_statements
CREATE USER <monitor_user> WITH PASSWORD '<secure_password>';
GRANT pg_monitor TO <monitor_user>;
This activates query metrics collection and grants secure read-only access using specified credentials. (replace <host_user> and <host_password> with your credentials).
Step 2 : Configure PostgreSQL Receiver in Otel Collector
Define the PostgreSQL receiver in your OpenTelemetry Collector with the code below:
apiVersion: v1

kind: ConfigMap

metadata:
[...]
receivers:
  postgresql:
    endpoint: "<POSTGRES_HOST>:5432"
    transport: tcp
    username: "<MONITORING_USER>"
    password: "<PASSWORD>"
    databases:
      - "<DATABASE_NAME>"
    collection_interval: 10s
    tls:
      insecure: true
      insecure_skip_verify: true
[...]- endpoint: Specifies the Postgresql host and port where the receiver connects to collect metrics.
- databases: Defines which Postgresql databases to monitor for telemetry data.
- collection_interval: Sets how frequently metrics are scraped from the Postgresql instance.
Replace
<POSTGRES_HOST>:5432,<MONITORING_USER>, and<PASSWORD>with your database host, port, username, and password.Ensure the monitoring user has
SELECTprivileges on Postgres statistics views (e.g.,pg_stat_database).
Note:
For optimizing connections between the Collector and PostgreSQL instance, configure the
connection_poolsettings based on your workload and database limits. You can adjust:
max_open: for maximum number of open connection
max_idle: for idle connections
max_lifetime: for the lifetime of each connection.Refer to the documentation to learn more.
Step 3: Adding the Postgresql Receiver to Your Metrics Pipeline
Update the service.pipelines.metrics section receive data from the postgresql receiver, defined above:
service:
  pipelines:
    metrics:
      receivers: [postgresql]
      [...]
With the PostgreSQL receiver enabled, the Collector can now collect and export database performance metrics to your chosen backend.
This setup provides native integration without external agents, keeping telemetry lightweight and efficient the upcoming diagram will illustrate the complete data flow.
Data Flow
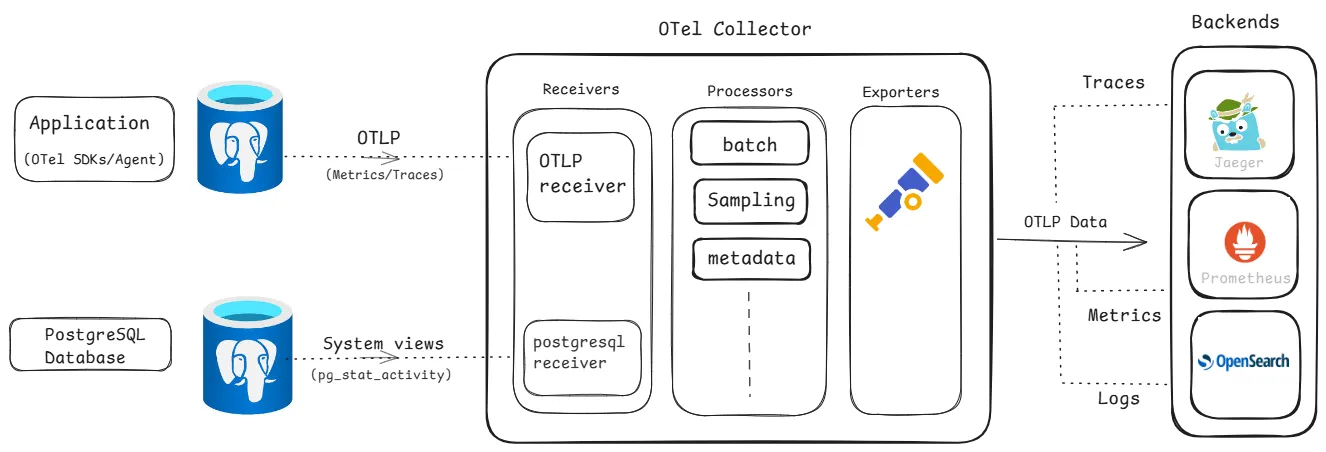
The below diagram shows the complete telemetry flow using OpenTelemetry for both the application and the PostgreSQL database.
-
Data Sources: The application (instrumented with OTel SDKs/agents) and PostgreSQL (via system views like pg_stat_activity) send metrics and traces to the OLTP receiver in the OTel Collector.
-
OTel Collector: Ingests telemetry over port 4317 (gRPC) and 4318 (HTTP), optionally processes using batch, sampling, or other processors, and then exports the data to the configured backends.
-
Backends: The Collector can then export telemetry to your preferred tracing, metrics, and logging backends, such as Tempo, Prometheus, or OpenSearch, depending on your setup.
The diagram offers end-to-end insights into application performance, query execution, and database health within a single telemetry pipeline for effective visualization of metrics and traces.
Visualising Metrics
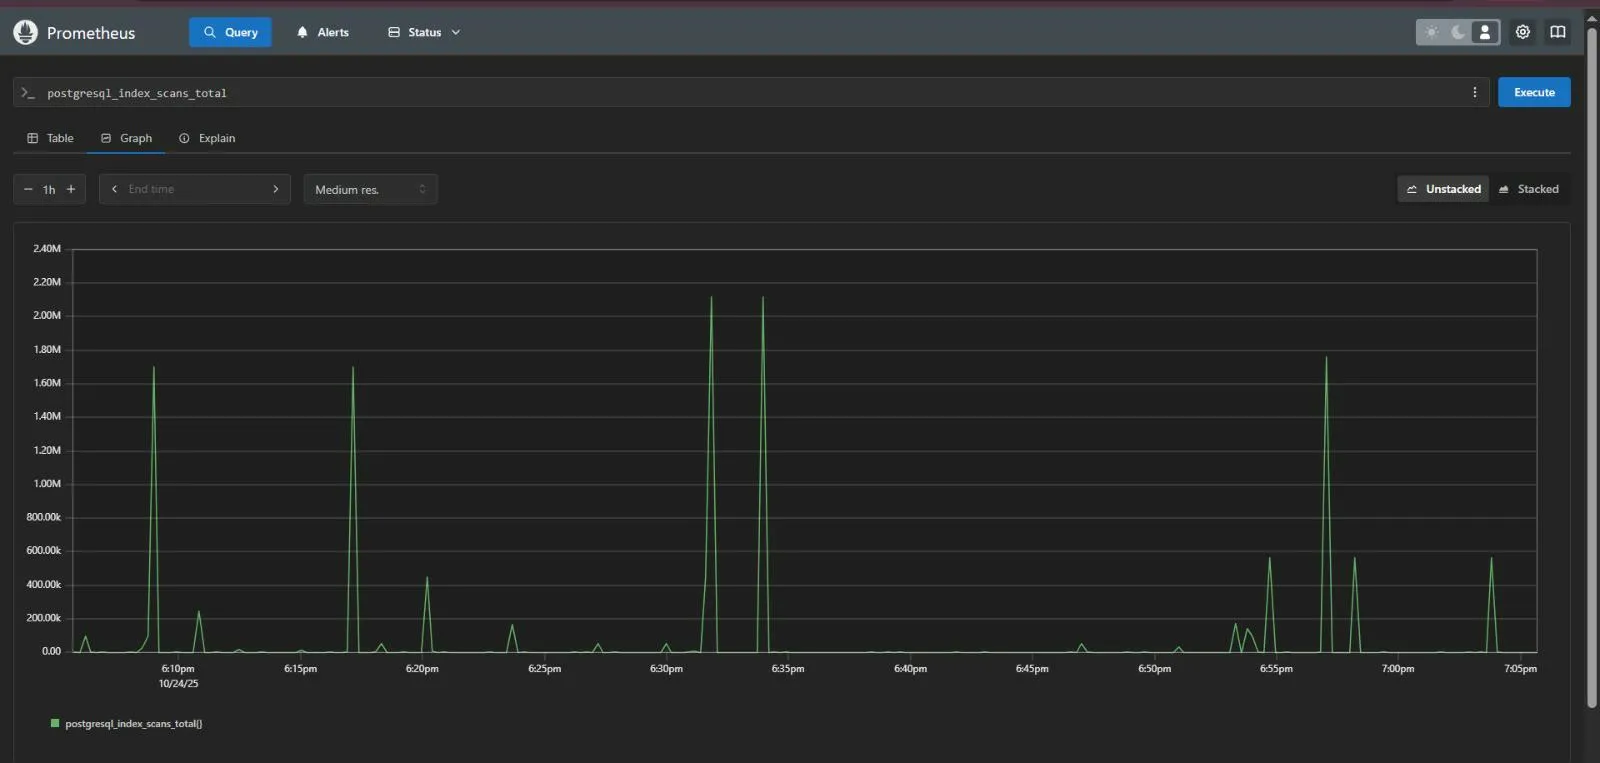
Once your OpenTelemetry pipeline is configured, you can plug in a Prometheus backend to monitor Postgresql metrics in real time and set up alerting rules for key performance signals.
Here we’ve queried the postgresql_index_scans_total which helps to track index scan activity, making it easier to detect heavy index usage or underutilized indexes across your database.
To explore critical Postgresql monitoring metrics covering query performance, index usage, and connection health making it “more urgent” refer to this Postgres Monitoring page.
You can also integrate a tracing backend like Jaeger to visualize spans such as query execution time, database latency, and transaction duration.
Here is an example of PostgreSQL tracing dashboard in Jaeger.
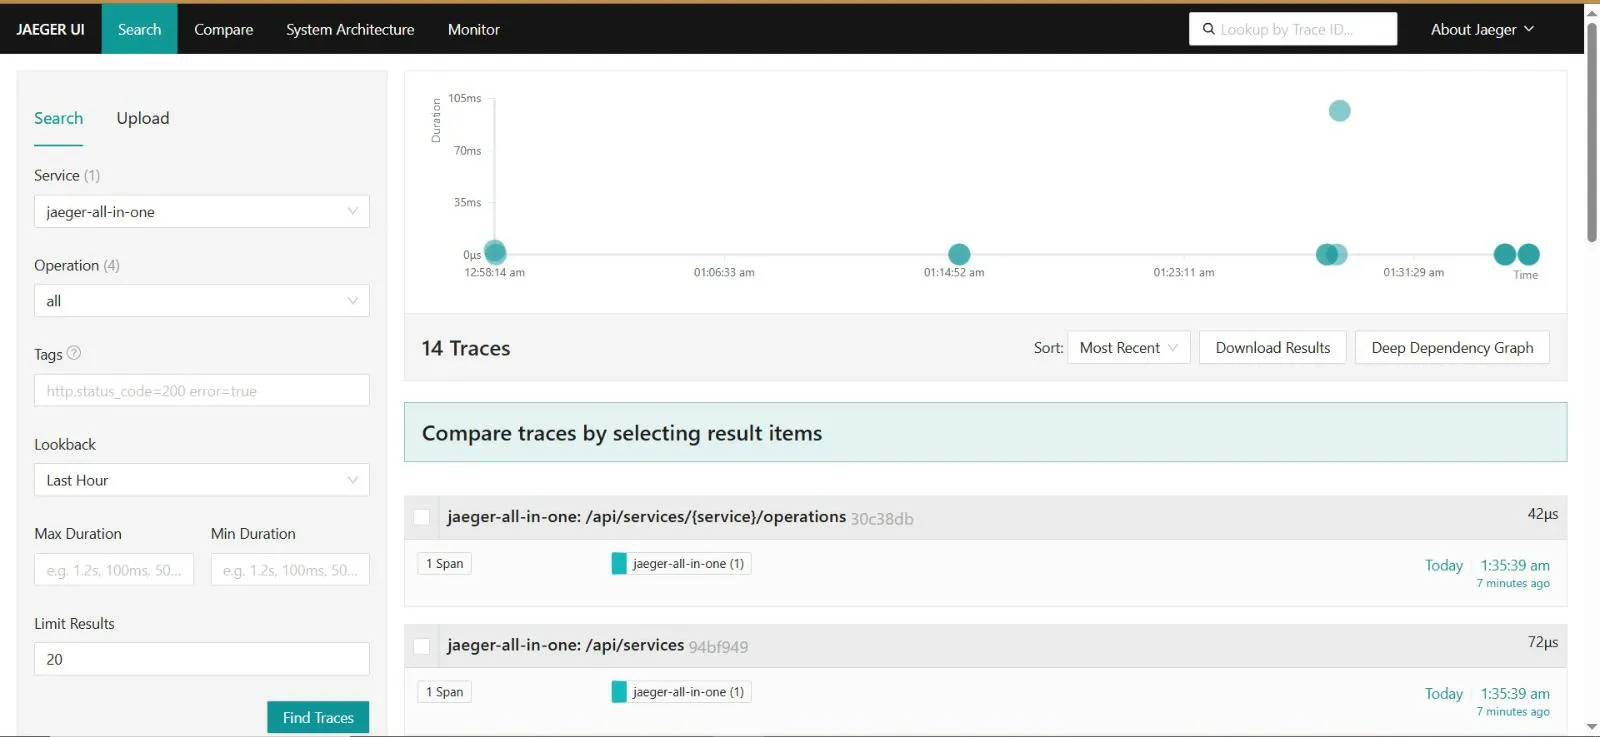
For more advanced trace analysis use the Jaeger UI to filter, search, and visualize trace spans for detecting bottlenecks.
With these visualizations in place, you now have end-to-end visibility into PostgreSQL performance, bringing you closer to a complete observability setup.
Conclusion
In this guide, we explored how to monitor PostgreSQL using OpenTelemetry’s server-side instrumentation.This setup gives you a lightweight, vendor-neutral path to understand and monitor your database performance.
Depending on your needs, you can pair this with application-level tracing for full-stack observability. To explore further, check the official OpenTelemetry documentation, PostgreSQL monitoring, and the Collector contrib GitHub repository.