
Monitoring Redis Metrics with OpenTelemetry

Isha Bhardwaj
December 15, 2025 · 6 min read
In short
Redis can hit memory fragmentation, eviction bursts, slow commands and blocked clients while still looking fast and reachable. Application-side instrumentation shows how the app uses Redis, while the server-side route, which this guide covers, uses the OpenTelemetry Collector's Redis receiver to read INFO statistics with no modules or code changes. You choose which metric groups to collect (commands, memory, keyspace and replication) and export them to any backend.
Redis is a high-performance in-memory data store for caching, messaging, and real-time workloads. Despite its low-latency design, it can still hit issues like memory fragmentation, replication-backlog overflow, cluster-slot migrations and fork-induced latency. Monitoring these conditions is critical for early stress detection and stable performance.
To address this, OpenTelemetry (OTel) offers a vendor-neutral and standardized approach to solve this by collecting Redis diagnostics, client-side traces, and performance metrics through a single, interoperable pipeline. As a result Redis telemetry can be analyzed centrally and exported to any backend without depending on proprietary exporters or fragmented tooling.
Client vs Server-Side Redis Instrumentation
Monitoring Redis with OpenTelemetry can be achieved through two complementary approaches, each capturing a different layer of telemetry depending on where the instrumentation is applied :
Client-Side Instrumentation (Application-Level Telemetry)
Use OpenTelemetry SDK/instrumentation libraries within application code. When issues like inefficient queries, excessive calls, or retry storms originate from the application layer this method captures -
Command Efficiency - Shows how the app uses Redis commands (e.g., excessive KEYS, heavy MGET, repeated retries) that can slow down the system even when Redis itself is fine.
Request Performance - Measures how long each call waits, how many calls are made at once, and which ones fail or retry, revealing app-created bottlenecks before they reach Redis.
Server-Side Instrumentation (Redis Engine Telemetry)
Uses the OpenTelemetry Collector’s native Redis receiver. When issues such as server overload, high memory usage, slow commands, or eviction-related performance drops, this method captures -
Memory Pressure & Evictions - Tracks exact eviction counts, memory fragmentation, and key expiry issues that directly affect latency and data loss.
Command Execution Impact - Surfaces slow command logs, blocked operations, and replication lag, helping detect which workloads are slowing the server.
| Category | Client-Side (Application-Level) | Server-Side (Redis Engine) |
|---|---|---|
| Metrics | Command latency, retries, failures | Memory usage, evictions, hit ratio |
| Traces | Command spans (GET, SET) | Engine performance, slow commands |
| Performance | Client timeouts, throughput | Key eviction, fragmentation |
| Errors | Timeouts, network failures | Memory errors, blocked clients |
| When to Use | Debug application behavior | Monitor Redis health + resources |
| Critical Observations | High latency, frequent retries | Memory saturation, eviction spikes |
The above table clearly highlights how observability differs in Redis when captured from the application vs. the database engine.
In this guide, we focus on exposing Redis internals such as memory saturation, eviction frequency, and the impact of slow or blocking commands without requiring any changes to application code.
Our emphasis remains on Server-side instrumentation to diagnose performance degradation, prevent data loss during evictions, and ensure consistent response times under high load.
Monitoring Redis with OpenTelemetry
Monitoring Redis is essential to detect memory saturation, eviction bursts, slow command execution, and blocked clients before they degrade application responsiveness.
While these indicators are available through built-in INFO statistics, manually parsing them or relying on client-specific libraries leads to inconsistent and fragmented monitoring at scale.
The native OpenTelemetry Redis Receiver streamlines this by converting internal Redis metrics such as hit ratio, eviction rate, command latency, and keyspace usage into a standardized telemetry format that can be exported and visualized across any preferred backend.
Prerequisites
Before configuring Redis monitoring with OpenTelemetry, ensure the following: OpenTelemetry Collector installed and accessible to your Redis server (Official Installation Guide) Redis instance running with accessible host/port (default: 6379) (Redis Setup Reference) Basic understanding of OTel receivers, processors, and exporters for building pipelines (OpenTelemetry Concepts Overview)
Instrumenting Redis with OpenTelemetry
The Redis receiver connects directly to a Redis instance and collects live metrics such as command rate, memory usage, eviction frequency, blocked clients, and cache hit ratio by querying internal INFO statistics without modifying application code.
Note : Redis does not require any additional modules for metric collection. Just make sure the instance is reachable and provide authentication credentials (only if they are enabled).
requirepass <redis-password># if authentication is enabledIf password authentication is disabled, skip this setting.
Step 1: Enable Redis Receiver in OpenTelemetry Collector
By enabling Redis receiver it communicates with Redis using its internal telemetry engine and collects key metrics related to memory usage, key activity, command performance, and replication health without altering the application code.
Define the Redis receiver in your OpenTelemetry Collector with the code below:
apiVersion: v1

kind: ConfigMap

metadata:
[...]

receivers:
  redis:
    endpoint: "<REDIS_HOST>:6379"
    collection_interval: 10s
    metrics:
      commands: true
      replication: true
      keyspace: true
      memory: true
[...]-
endpoint – Specifies the Redis host and port the receiver connects to for metric collection.
-
collection_interval – Determines how often the Collector scrapes Redis metrics.
-
metrics – Defines which categories of metrics to collect, including -
commands– Tracks command execution stats such as call count, latency, and CPU usage.
memory– Monitors memory consumption and limits.
keyspace– Provides cache hit/miss counts, expired keys, and evictions.
replication– Shows node role (master/replica) and replica offset.
Note: You can enable only the metrics relevant to your use case. Enabling all provides a complete picture but may increase telemetry volume.
Replace <REDIS_HOST> with your Redis server address, and include authentication credentials if required. For example:
endpoint: "redis.example.com:6379"Step 2: Add Redis Receiver to the Metrics Pipeline
Integrate the Redis receiver into your Collector’s metrics pipeline so it streams data to your backend for visualization and monitoring:
service:
  pipelines:
    metrics:
      receivers: [redis]
     [...]
With the Redis receiver enabled, the Collector continuously collects key metrics from your Redis instance and forwards them to your chosen monitoring backend.
These configurations provide non-intrusive visibility to Redis behaviour while keeping the telemetry flow efficient and lightweight.
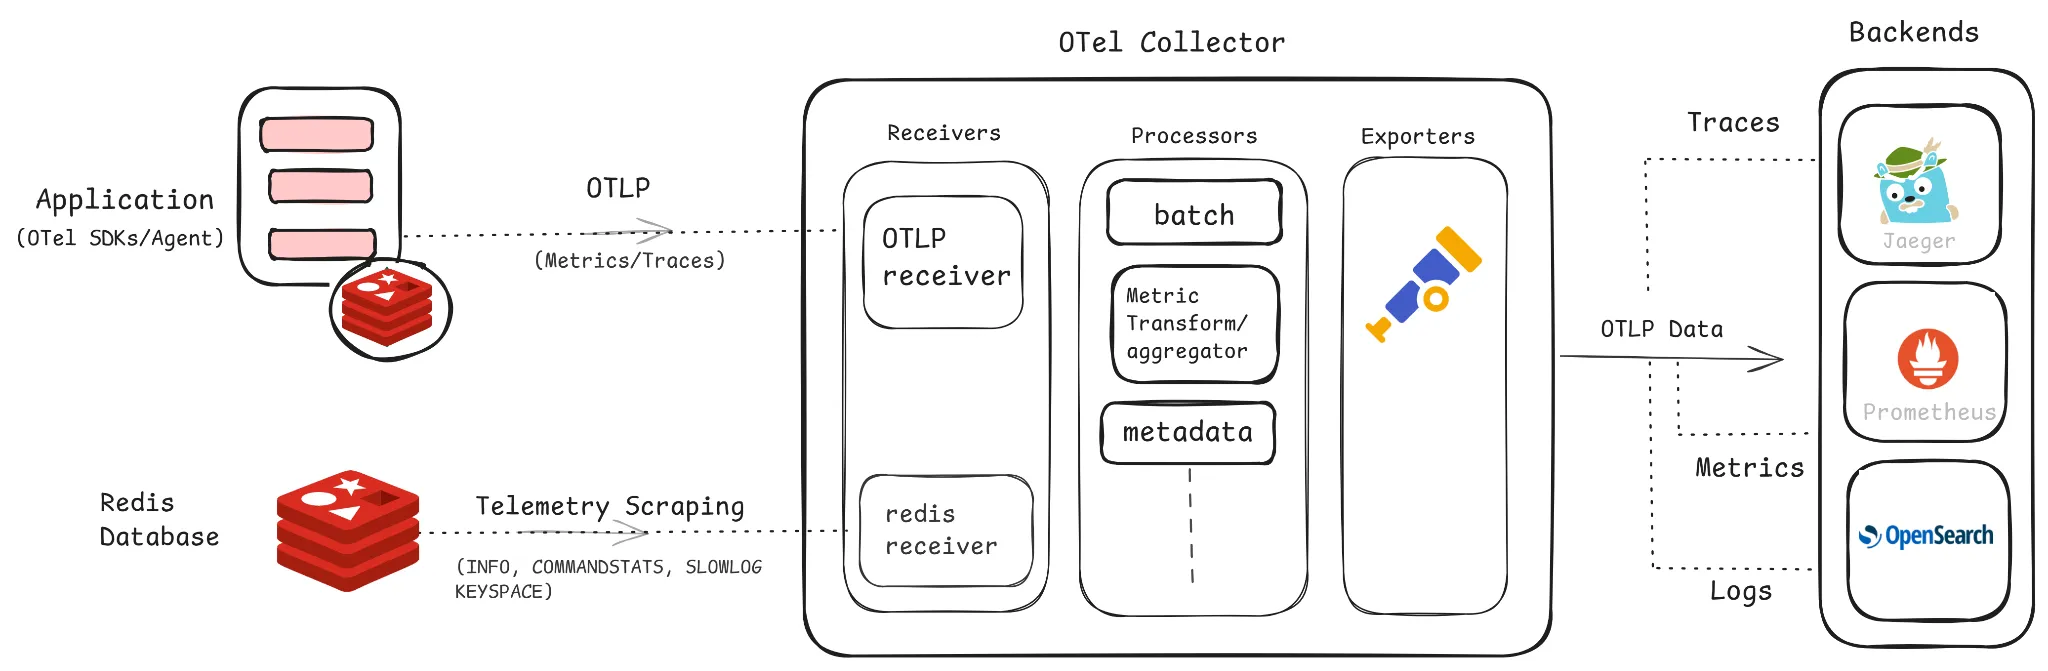
The following diagram will show the complete Redis telemetry flow, showing data collection from both the application and Redis engine through OpenTelemetry to monitoring backends.
Data Flow
The below diagram illustrates the complete telemetry flow using OpenTelemetry for both the application and the Redis database.
-
Data Sources - The Application (instrumented using OTel SDKs/agents) sends traces/metrics via OTLP. Redis Database exposes system telemetry using built-in commands such as
INFO, COMMANDSTATS, SLOWLOG, andKEYSPACE, which are scraped by the Redis receiver. -
OTel Collector - Ingests telemetry over ports 4317 (gRPC) and 4318 (HTTP) from the application, while scraping Redis metrics on port 6379. Optionally processes data using processors like batch, metric transformation, or metadata enrichment, before sending it to exporters.
-
Backends - The Collector exports the processed data to monitoring systems such as Jaeger/Tempo (traces), Prometheus (metrics), and OpenSearch (metrics/logs) based on user configuration.
The data flow above provides unified visibility into Redis performance and application behavior within a shared observability pipeline, enabling it to move onto the clean visualization part of cache usage, latency, memory patterns, and trace correlations.
Visualising Metrics
Once your OpenTelemetry pipeline is configured, you can plug into any preferred backend to monitor Redis metrics in real time and define alerting rules for key operational indicators.
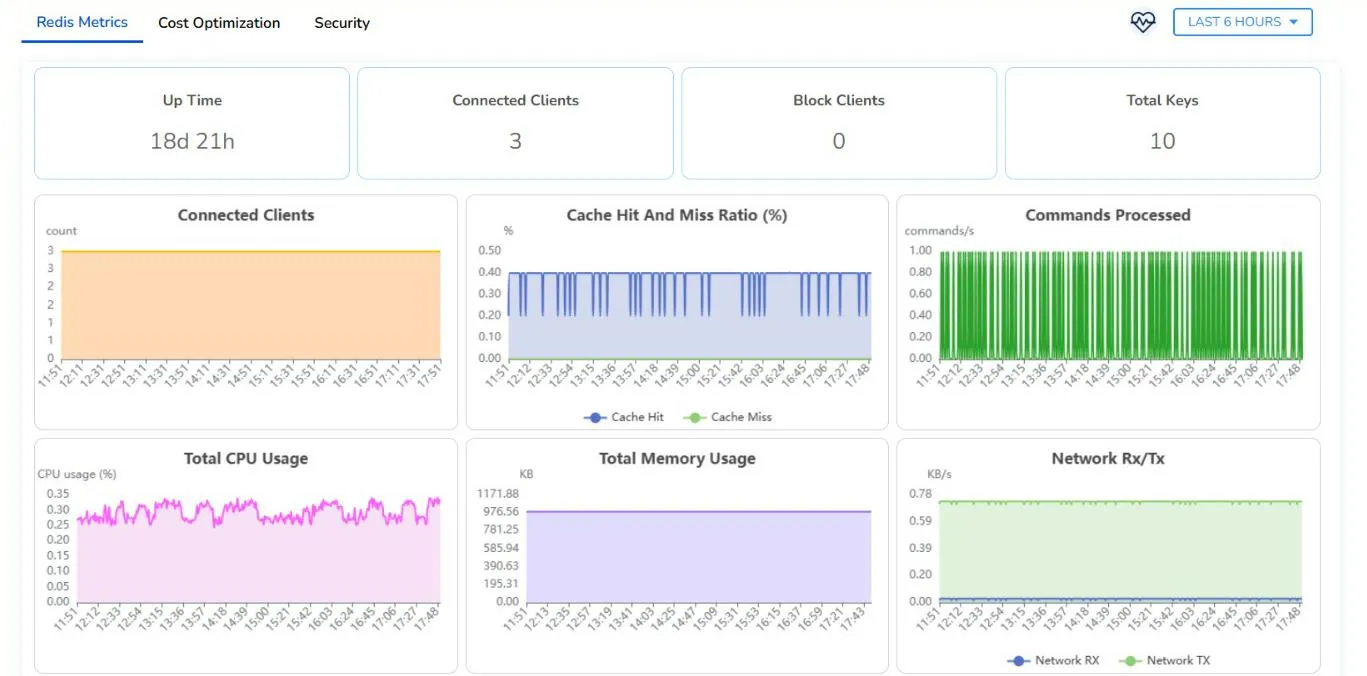
Below is a screenshot of the Redis metrics dashboard in Randoli, which provides live visibility into essential Redis metrics including critical health insights such as CPU and memory consumption, commands processed, network throughput (Rx/Tx), and potential stability risks and runtime statistics.
To explore critical Redis monitoring metrics covering memory usage, key eviction, and command performance, making it high-priority, check out this Redis Monitoring documentation.
These visualizations provide a consolidated view of Redis performance posture, enabling proactive insight into cache efficiency, execution pressure, and memory dynamics essential for maintaining a reliable and optimized caching layer moving closer to a complete observability setup for Redis.
Conclusion
In this guide, we looked at monitoring Redis using OpenTelemetry’s server-side instrumentation, giving you a lightweight, vendor-neutral approach to observe memory utilization, cache behavior, key eviction patterns, data replication status and other operational insights.
Based on your requirements, you can extend this with application-level tracing to gain visibility across both your Redis engine and the interacting application. For more details, check out the official OpenTelemetry documentation, Redis monitoring guides, and the Collector contrib GitHub repository.